
Hawkesbury Business Emissions Profile
Achieving Net Zero Emissions
Hawkesbury City Council is using 2016/2017 as a baseline year in which to compare the community’s progress towards our Net Zero Emissions by 2030 or sooner target and to track our water usage.
Where are we now? - 2019/2020
The information below outlines the Hawkesbury business community emissions profile and water usage for the baseline year and for where we are now.
The 2019/2020 data is the most recent available data in the Resilient Sydney Platform. This page will be updated when data for 2020/2021 and 2021/2022 is made available.
Hawkesbury’s Overall Business Emissions – 2019/2020
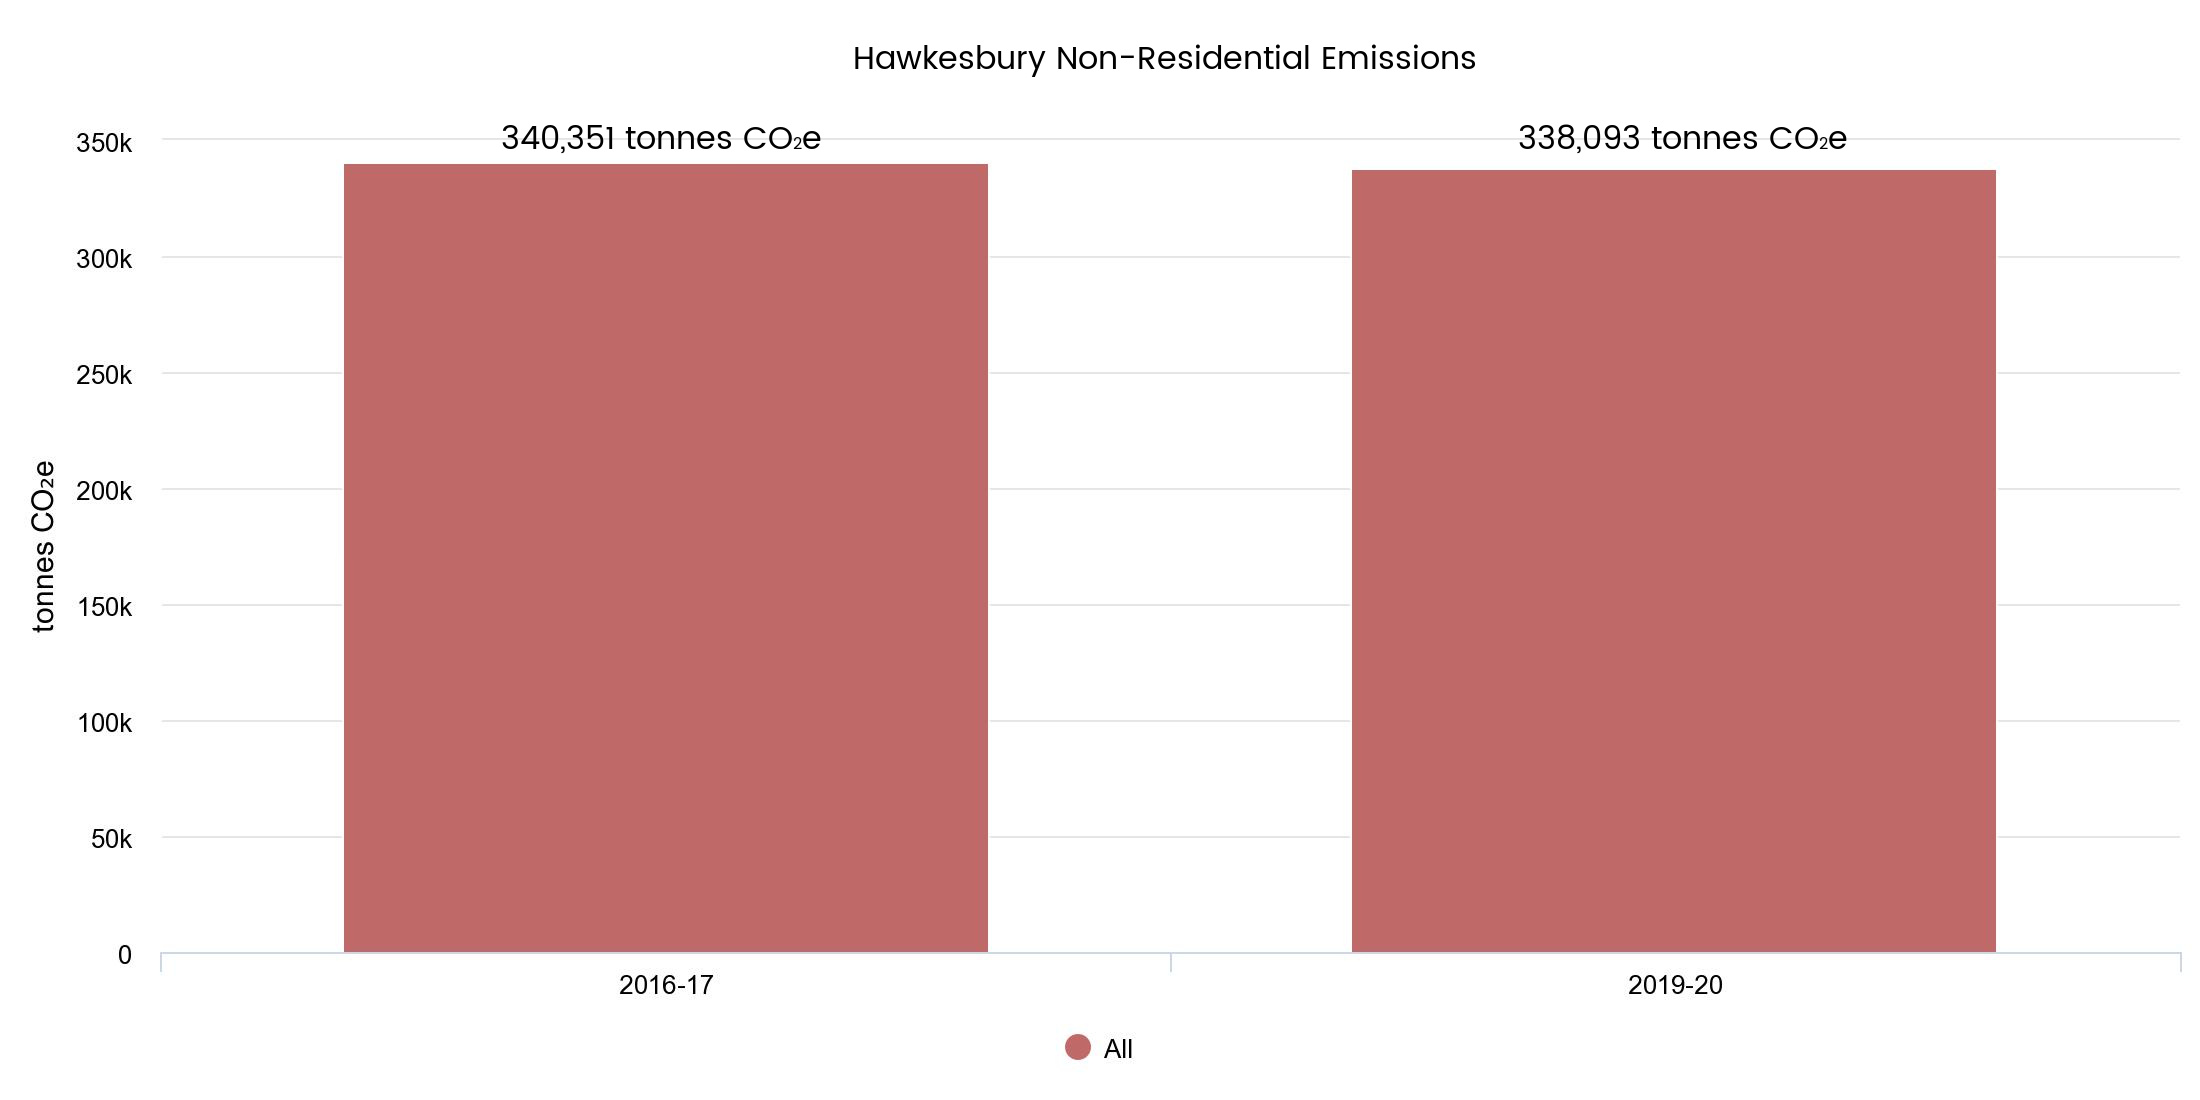
Overall, from 2016/2017 to 2019/2020 business emissions in the Hawkesbury have decreased.
Hawkesbury’s Businesses Electricity and Gas Emissions – 2019/2020
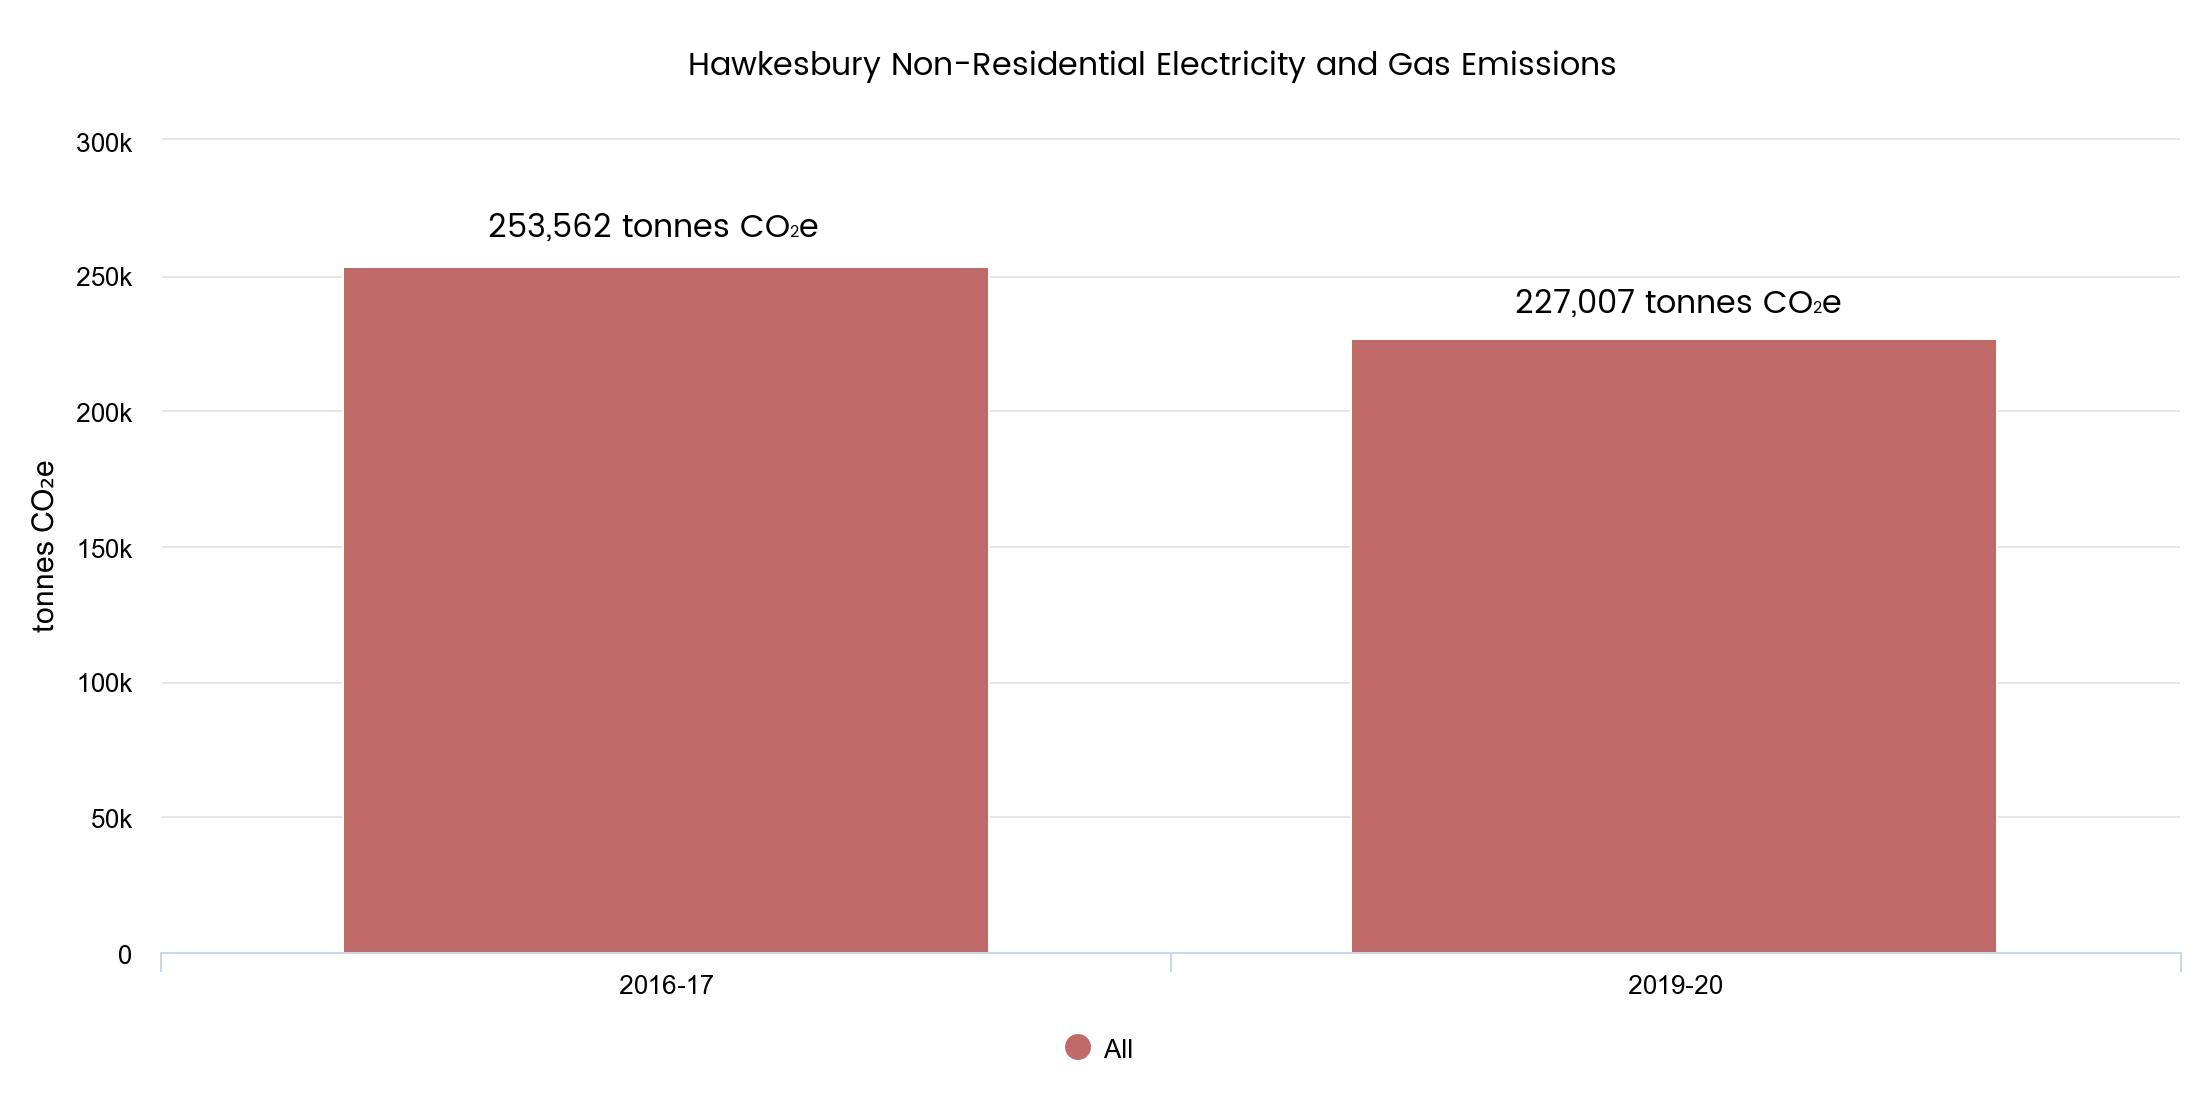
From 2016/2017 to 2019/2020 Hawkesbury’s businesses emissions from electricity and gas use have decreased.
Hawkesbury’s Businesses Water Use – 2019/2020
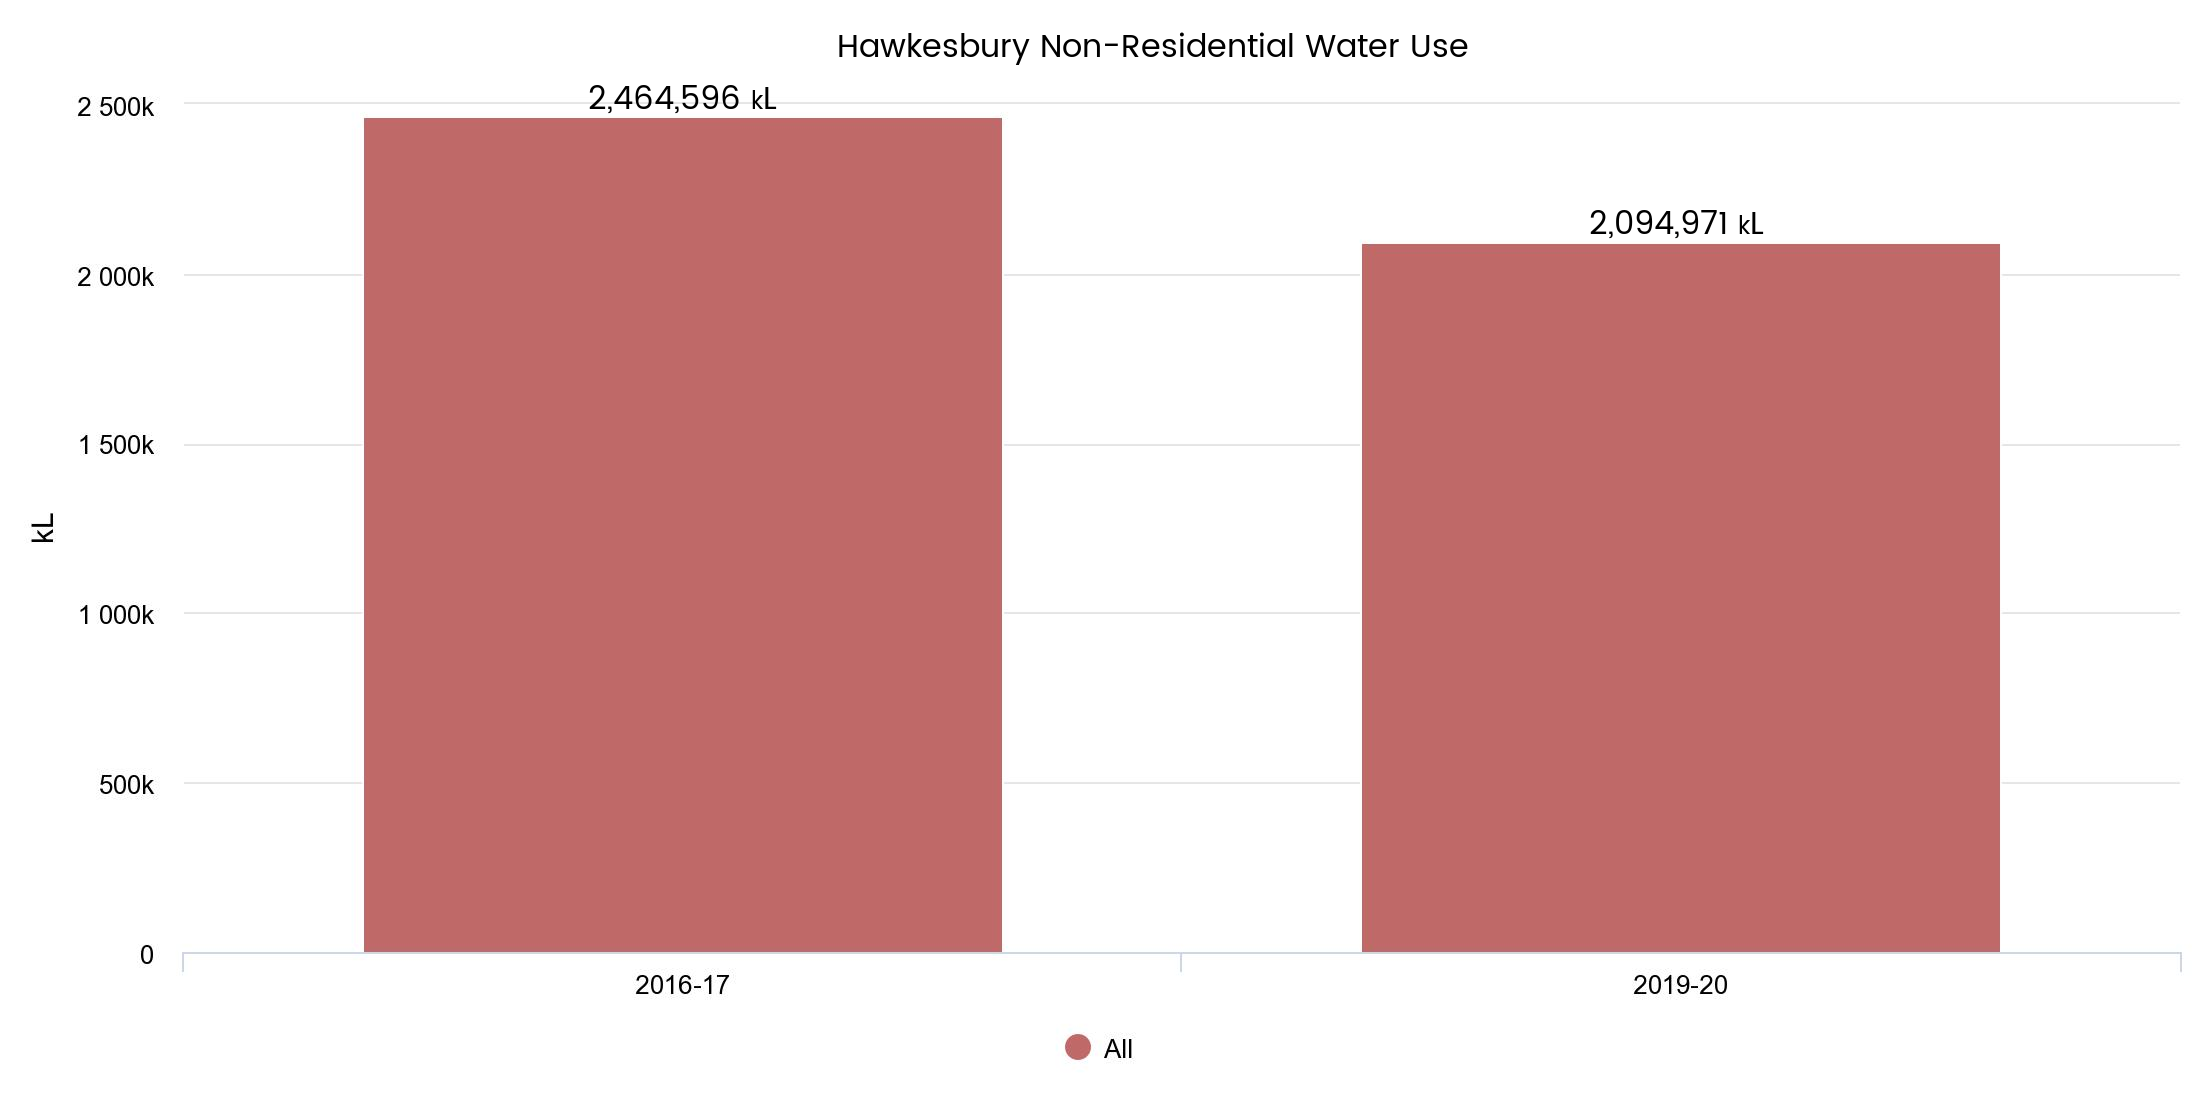
From 2016/2017 to 2019/2020 Hawkesbury’s businesses water use decreased.
Hawkesbury’s Businesses Transport Emissions – 2019/2020
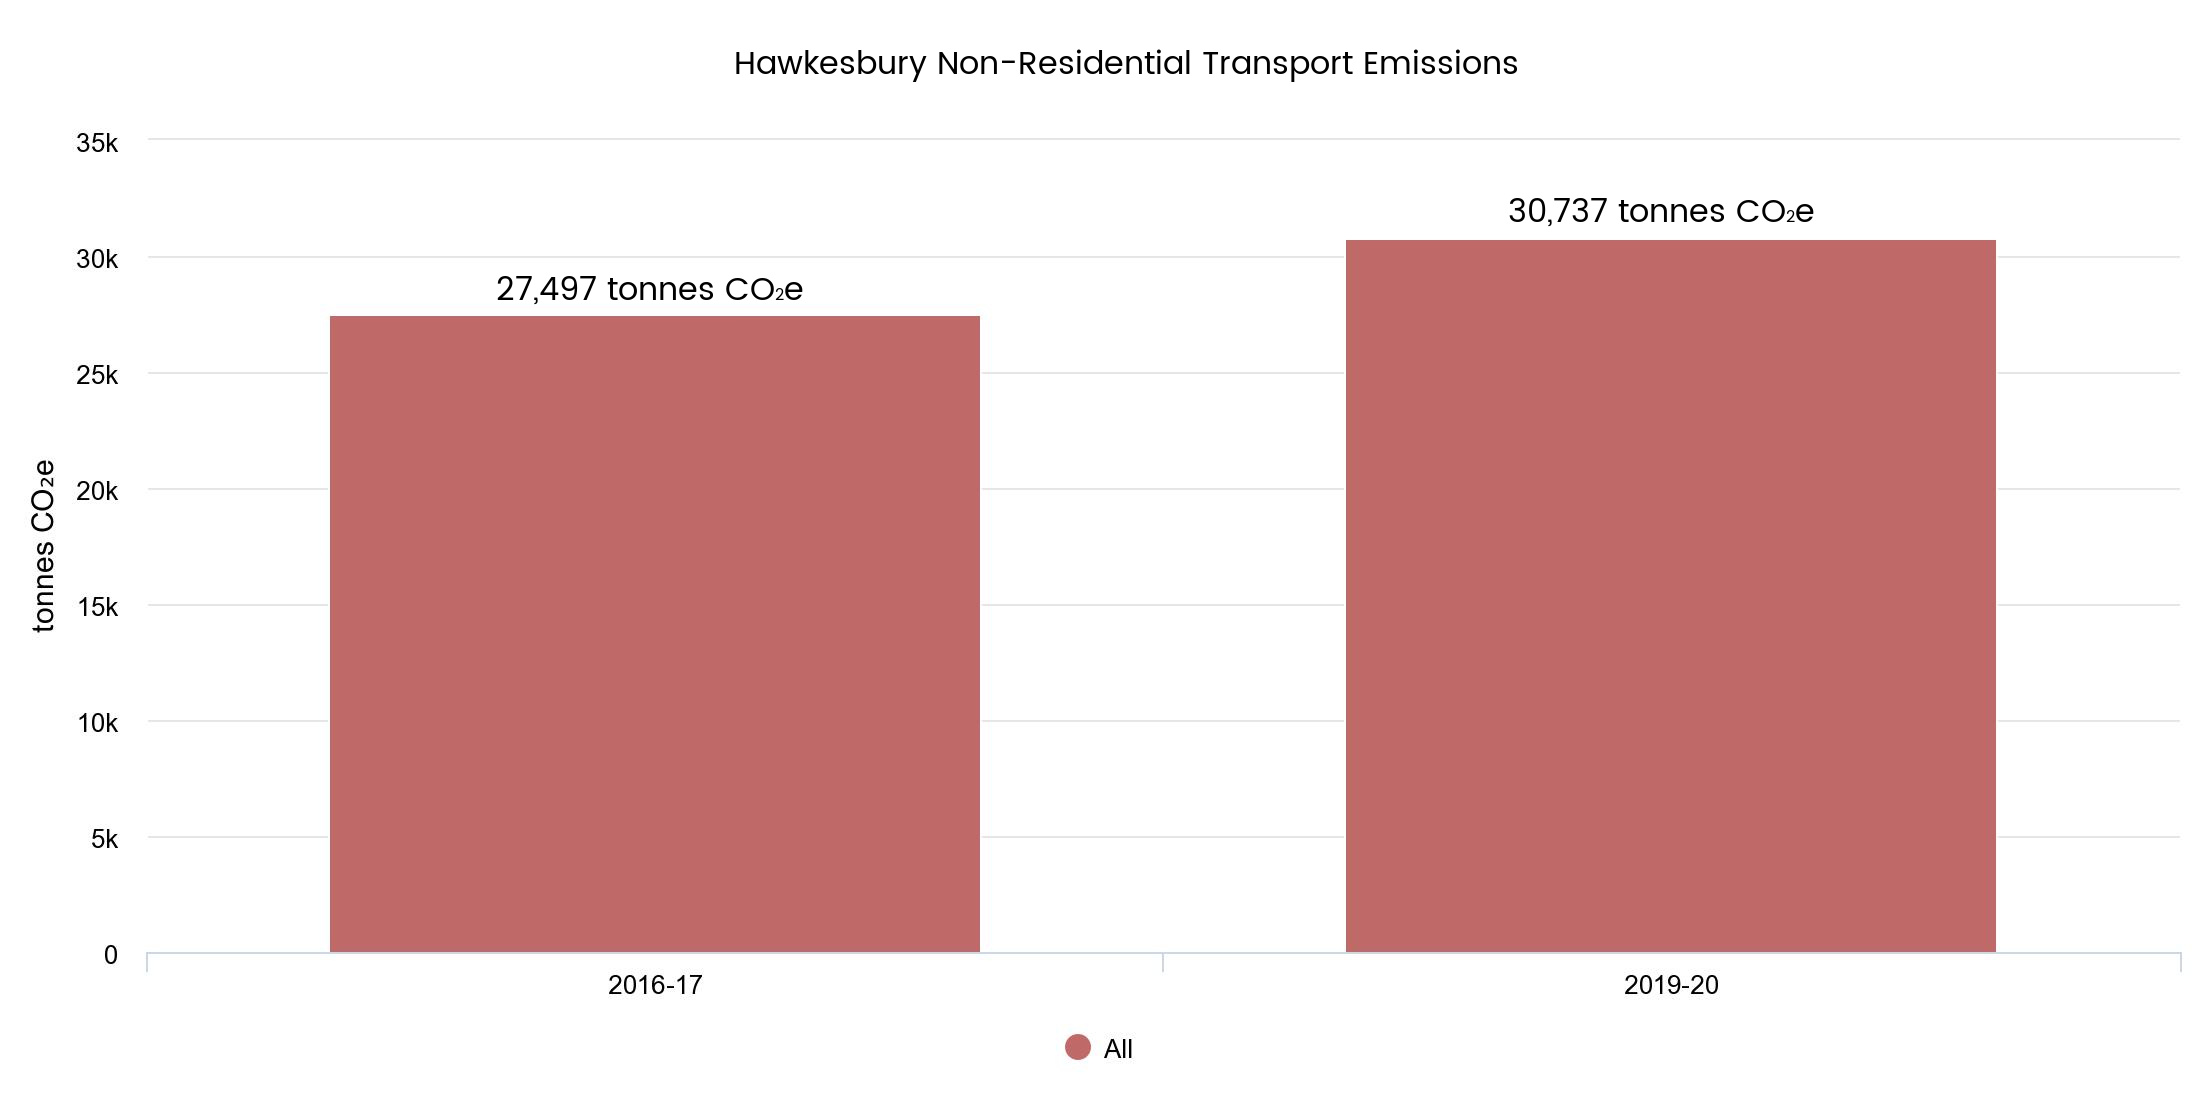
Hawkesbury’s Businesses Waste Generation – 2019/2020
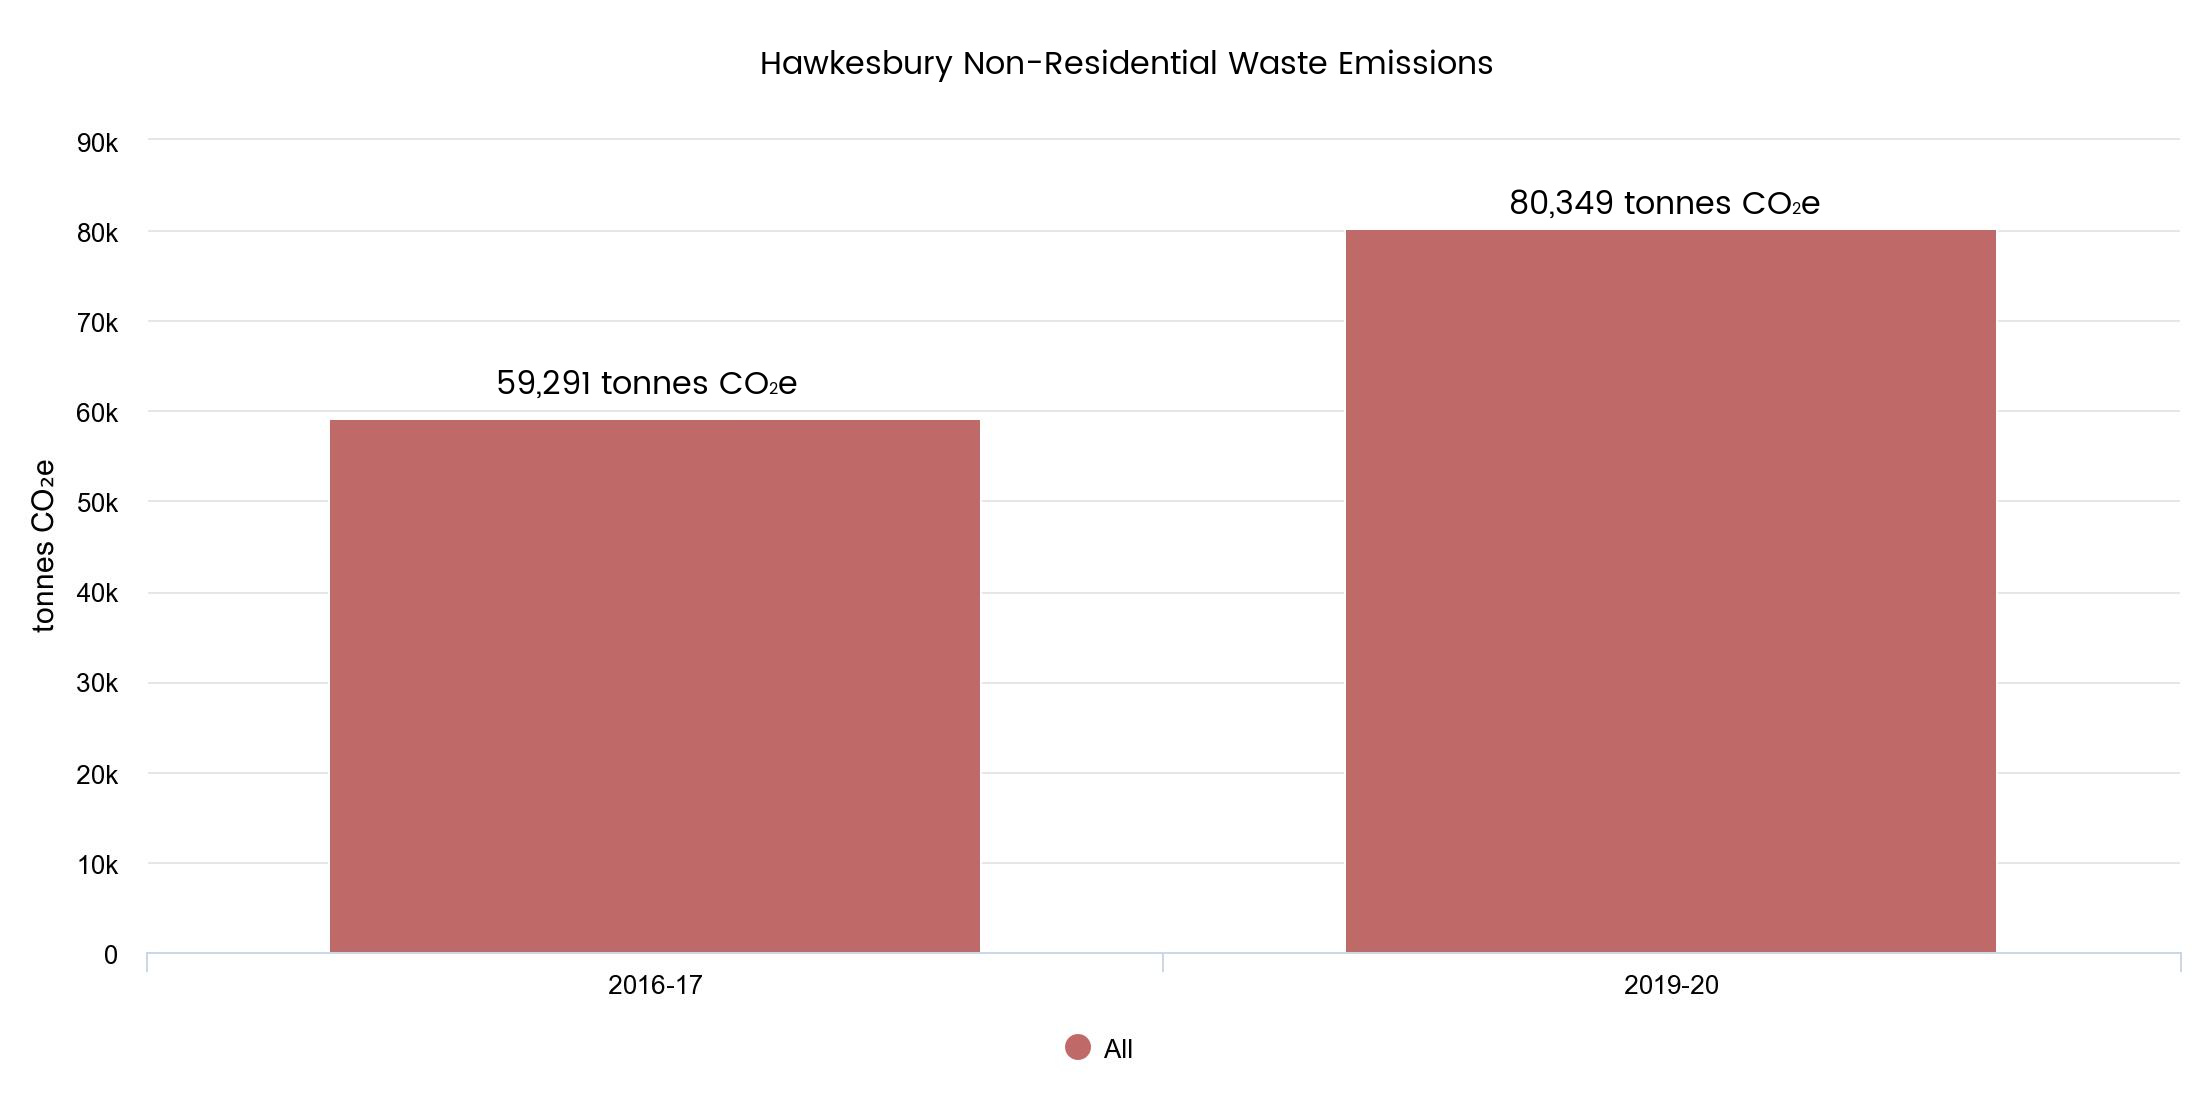
From 2016/2017 to 2019/2020 Hawkesbury’s businesses emissions from waste increased.
Data sources:
This data was sourced through the Resilient Sydney Platform, under the Resilient Sydney Program.
Page ID: 220149
